At work recently, I had the chance to work on and learn about some interesting machine learning problems (around customer retention) and in my spare time, I’ve started doing some additional problems on Kaggle to get more exposure to some different datasets and modeling techniques.
I figured that by blogging about it, it would force me to keep my code sane and legible. So to kick things off, here’s my solution to the Titanic competition. The goal here was to predict who survived or not based on attributes such as gender, age, boarding class, port of embarkation, and a few others.
My model is pretty simple, and I certainly could have done a bunch more in terms of feature engineering, but even still it clocked in with an accuracy of 80.4% (top 15% at the time of this post). My decently commented code is below, and I have a repo on GitHub too if you’re in to that sort of thing.
import itertools
import pandas as pd
import numpy as np
import matplotlib.pyplot as plt
import seaborn as sns
from sklearn.ensemble import RandomForestClassifier
from sklearn.cross_validation import StratifiedKFold, train_test_split
from sklearn.grid_search import GridSearchCVpd.set_option('display.width', 500)
pd.set_option('display.max_columns', 30)
sns.set_style("darkgrid")
sns.set_context(rc={"figure.figsize": (6, 3)})# load in datasets
dfs = {}
for name in ['train', 'test']:
df = pd.read_csv('../data/%s.csv' % name)
# add a column denoting source (train/test)
df['data'] = name
# add df to dfs dict
dfs[name] = df# basic info about columns in each dataset
for name, df in dfs.iteritems():
print 'df: %s\n' % name
print 'shape: %d rows, %d cols\n' % df.shape
print 'column info:'
for col in df.columns:
print '* %s: %d nulls, %d unique vals, most common: %s' % (
col,
df[col].isnull().sum(),
df[col].nunique(),
df[col].value_counts().head(2).to_dict()
)
print '\n------\n'df: test
shape: 418 rows, 12 cols
column info:
* PassengerId: 0 nulls, 418 unique vals, most common: {1128: 1, 1023: 1}
* Pclass: 0 nulls, 3 unique vals, most common: {1: 107, 3: 218}
* Name: 0 nulls, 418 unique vals, most common: {'Rosenbaum, Miss. Edith Louise': 1, 'Beauchamp, Mr. Henry James': 1}
* Sex: 0 nulls, 2 unique vals, most common: {'male': 266, 'female': 152}
* Age: 86 nulls, 79 unique vals, most common: {24.0: 17, 21.0: 17}
* SibSp: 0 nulls, 7 unique vals, most common: {0: 283, 1: 110}
* Parch: 0 nulls, 8 unique vals, most common: {0: 324, 1: 52}
* Ticket: 0 nulls, 363 unique vals, most common: {'PC 17608': 5, '113503': 4}
* Fare: 1 nulls, 169 unique vals, most common: {7.75: 21, 26.0: 19}
* Cabin: 327 nulls, 76 unique vals, most common: {'B57 B59 B63 B66': 3, 'C101': 2}
* Embarked: 0 nulls, 3 unique vals, most common: {'S': 270, 'C': 102}
* data: 0 nulls, 1 unique vals, most common: {'test': 418}
------
df: train
shape: 891 rows, 13 cols
column info:
* PassengerId: 0 nulls, 891 unique vals, most common: {891: 1, 293: 1}
* Survived: 0 nulls, 2 unique vals, most common: {0: 549, 1: 342}
* Pclass: 0 nulls, 3 unique vals, most common: {1: 216, 3: 491}
* Name: 0 nulls, 891 unique vals, most common: {'Graham, Mr. George Edward': 1, 'Elias, Mr. Tannous': 1}
* Sex: 0 nulls, 2 unique vals, most common: {'male': 577, 'female': 314}
* Age: 177 nulls, 88 unique vals, most common: {24.0: 30, 22.0: 27}
* SibSp: 0 nulls, 7 unique vals, most common: {0: 608, 1: 209}
* Parch: 0 nulls, 7 unique vals, most common: {0: 678, 1: 118}
* Ticket: 0 nulls, 681 unique vals, most common: {'CA. 2343': 7, '347082': 7}
* Fare: 0 nulls, 248 unique vals, most common: {13.0: 42, 8.0500000000000007: 43}
* Cabin: 687 nulls, 147 unique vals, most common: {'G6': 4, 'C23 C25 C27': 4}
* Embarked: 2 nulls, 3 unique vals, most common: {'S': 644, 'C': 168}
* data: 0 nulls, 1 unique vals, most common: {'train': 891}
------
# combine train and test data into one df
df = dfs['train'].append(dfs['test'])

# lowercase column names
df.columns = map(str.lower, df.columns)

# reorder columns
new_col_order = ['data', 'passengerid', 'survived', 'age',
                'cabin', 'embarked', 'fare', 'name', 'parch',
                'pclass', 'sex', 'sibsp', 'ticket']
df = df[new_col_order]

df.head()| data | passengerid | survived | age | cabin | embarked | fare | name | parch | pclass | sex | sibsp | ticket | |
|---|---|---|---|---|---|---|---|---|---|---|---|---|---|
| 0 | train | 1 | 0 | 22 | NaN | S | 7.2500 | Braund, Mr. Owen Harris | 0 | 3 | male | 1 | A/5 21171 |
| 1 | train | 2 | 1 | 38 | C85 | C | 71.2833 | Cumings, Mrs. John Bradley (Florence Briggs Th... | 0 | 1 | female | 1 | PC 17599 |
| 2 | train | 3 | 1 | 26 | NaN | S | 7.9250 | Heikkinen, Miss. Laina | 0 | 3 | female | 0 | STON/O2. 3101282 |
| 3 | train | 4 | 1 | 35 | C123 | S | 53.1000 | Futrelle, Mrs. Jacques Heath (Lily May Peel) | 0 | 1 | female | 1 | 113803 |
| 4 | train | 5 | 0 | 35 | NaN | S | 8.0500 | Allen, Mr. William Henry | 0 | 3 | male | 0 | 373450 |
# convert sex to ints (male = 1, female = 0)
df['gender'] = df['sex'].apply(lambda x: 1 if x == 'male' else 0)

# extract title
df['title'] = df['name'].apply(lambda x: x.split(',')[1].split('.')[0].strip())

# fill missing age with mean by title
age_by_title = df.groupby('title')['age'].agg(np.mean).to_dict()
df['age'] = df.apply(lambda row: age_by_title.get(row['title'])
                     if pd.isnull(row['age']) else row['age'], axis=1)

# fill missing fare with median by pclass
# some people have a fare = 0, so only look at those > 0
fare_by_pclass = df[df['fare'] > 0].groupby('pclass')['fare'].agg(np.median).to_dict()
df['fare'] = df.apply(lambda r: r['fare'] if r['fare'] > 0
                      else fare_by_pclass.get(r['pclass']), axis=1)

# fill missing embarked with most common port
most_common_port = df['embarked'].mode()[0]
df['embarked'] = df['embarked'].fillna(most_common_port)

# transform categorical embarked column to 1/0 dummy columns
dummies = pd.get_dummies(df['embarked'], prefix='port')
df = pd.concat([df, dummies], axis=1)

df.iloc[0]
data train
passengerid 1
survived 0
age 22
cabin NaN
embarked S
fare 7.25
name Braund, Mr. Owen Harris
parch 0
pclass 3
sex male
sibsp 1
ticket A/5 21171
gender 1
title Mr
port_C 0
port_Q 0
port_S 1
Name: 0, dtype: object
# drop unnecessary columns
drop_cols = ['cabin', 'name', 'sex', 'ticket', 'title', 'embarked']
df = df.drop(drop_cols, axis=1)

df.head()| data | passengerid | survived | age | fare | parch | pclass | sibsp | gender | port_C | port_Q | port_S | |
|---|---|---|---|---|---|---|---|---|---|---|---|---|
| 0 | train | 1 | 0 | 22 | 7.2500 | 0 | 3 | 1 | 1 | 0 | 0 | 1 |
| 1 | train | 2 | 1 | 38 | 71.2833 | 0 | 1 | 1 | 0 | 1 | 0 | 0 |
| 2 | train | 3 | 1 | 26 | 7.9250 | 0 | 3 | 0 | 0 | 0 | 0 | 1 |
| 3 | train | 4 | 1 | 35 | 53.1000 | 0 | 1 | 1 | 0 | 0 | 0 | 1 |
| 4 | train | 5 | 0 | 35 | 8.0500 | 0 | 3 | 0 | 1 | 0 | 0 | 1 |
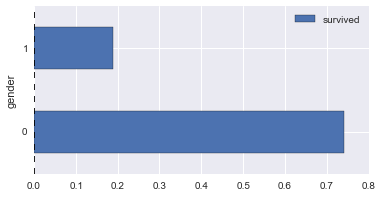
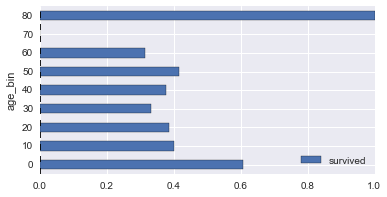
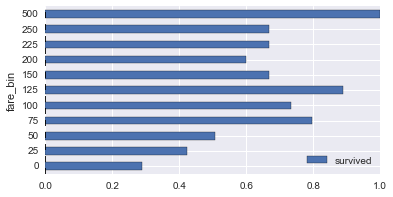
# survival rates across various columns

def plot_survive_rate(df, col, chart='barh'):
    survive_rates = df.groupby(col).agg({
        'survived': lambda x : sum(x) / len(x)
    })
    survive_rates.plot(kind=chart);

def bin_num(x, base=5):
    return int(x - (x % base))

# get cleaned training data
dg = df[df['data'] == 'train'].copy()

# discretize age & fare
dg['age_bin'] = dg['age'].apply(lambda x: bin_num(x, 10))
dg['fare_bin'] = dg['fare'].apply(lambda x: bin_num(x, 25))

for col in ['pclass', 'gender', 'age_bin', 'fare_bin']:
    plot_survive_rate(dg, col)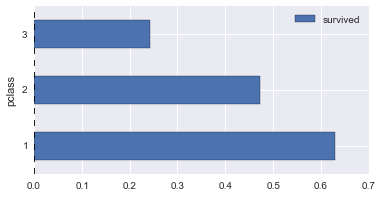
# store the columns (features) to be used for classifying survival
x_cols = df.columns.values[3:]

print '%d total features' % len(x_cols)
print x_cols
9 total features
['age' 'fare' 'parch' 'pclass' 'sibsp' 'gender' 'port_C' 'port_Q' 'port_S']
# prep training data for classifying
# (separating features and metric we're predicting)

df_train = df[df['data'] == 'train']

X = df_train[x_cols].as_matrix()
y = df_train['survived'].as_matrix()

print '%d rows, %d features' % (len(df_train), len(x_cols))
891 rows, 9 features
# cross validation to evaluate model
# (dividing training data into n chunks and training model n times
# with a different holdout chunk each time)

cv = StratifiedKFold(y, n_folds=6)
tot_correct, tot_obs = 0, 0

for i, (train, test) in enumerate(cv):
    X_train = X[train]
    y_train = y[train]
    X_test = X[test]
    y_test = y[test]

    model = RandomForestClassifier(random_state=321)
    model.fit(X_train, y_train)

    y_pred = model.predict(X_test)

    correct, obs = (y_test == y_pred).sum(), len(y_test)
    tot_correct += correct
    tot_obs += obs

print 'accuracy: %f' % (tot_correct * 1.0 / tot_obs)
accuracy: 0.799102
# evaluate model over entire training set
# and look at each feature's importance

model = RandomForestClassifier(random_state=321)
model.fit(X, y)

feature_rank = pd.Series(model.feature_importances_, index=x_cols).order(ascending=False)
feature_rank
fare 0.265518
age 0.264835
gender 0.259047
pclass 0.078497
sibsp 0.054447
parch 0.046165
port_S 0.011954
port_C 0.011904
port_Q 0.007634
dtype: float64
# model parameter tuning
# (there are several input parameters to a random forest model;
# grid search automates the process of tweaking these parameters to find the
# optimal values for these parameters)

param_grid = {
    "n_estimators": [100],
    "criterion": ["gini", "entropy"],
    'max_features': [0.5, 1.0, "sqrt"],
    'max_depth': [4, 5, 6, 7, 8, None],
}

model = RandomForestClassifier(random_state=321)
grid_search = GridSearchCV(model, param_grid, cv=12, verbose=0)
grid_search.fit(X, y)

print grid_search.best_score_
print grid_search.best_params_
0.836139169473
{'max_features': 0.5, 'n_estimators': 100, 'criterion': 'entropy', 'max_depth': 7}
# train model with best parameters from grid search
# and finally predict survival of people from test data

df_train = df[df['data'] == 'train'].copy()

X_train = df_train[x_cols].as_matrix()
y_train = df_train['survived'].as_matrix()

model = RandomForestClassifier(
    n_estimators=100,
    criterion='entropy',
    max_features=0.5,
    max_depth=7,
    random_state=321,
)

model.fit(X_train, y_train)

df_test = df[df['data'] == 'test'].copy()

X_test = df_test[x_cols].as_matrix()
y_pred = model.predict(X_test).astype(int)

df_test['survived'] = y_pred

final_df = df_test[['passengerid', 'survived']]
final_df.to_csv('../output/predicted.csv', index=False)
print 'boom.'
boom.