I’ve finally started to learn and play around with React, a Javascript library for building user interfaces developed by Facebook. And boy, it’s fun. After about 15 minutes of feeling icky about mixing JS and HTML, I started to love it — bringing together the functionality and markup when they’re so intertwined makes things so much easier to iterate on, debug, and understand.
I definitely still have TONS to learn, but I wanted to share some of the resources I found helpful, and the first thing I built with React.
I went through a lot of tutorials. Here were my favorites:
- React For stupid people
- 5 practical examples for learning React
- Removing user interface complexity, or why React is awesome
- Facebook’s official tutorial
- React examples: mailbox
- React for people who know jQuery
I made it a point to write out all the code from the tutorials (no copying and pasting!), which forced me to not skim over anything and reinforced the patterns I started to see. Here’s the repo where I kept everything.
Then, I took off the tutorial training wheels and built something small on my own. Let’s go through it. It’s a simple interface where users can type or paste in numbers and see summary statistics and a histogram of the data. And as the data changes, things should hopefully update accordingly.
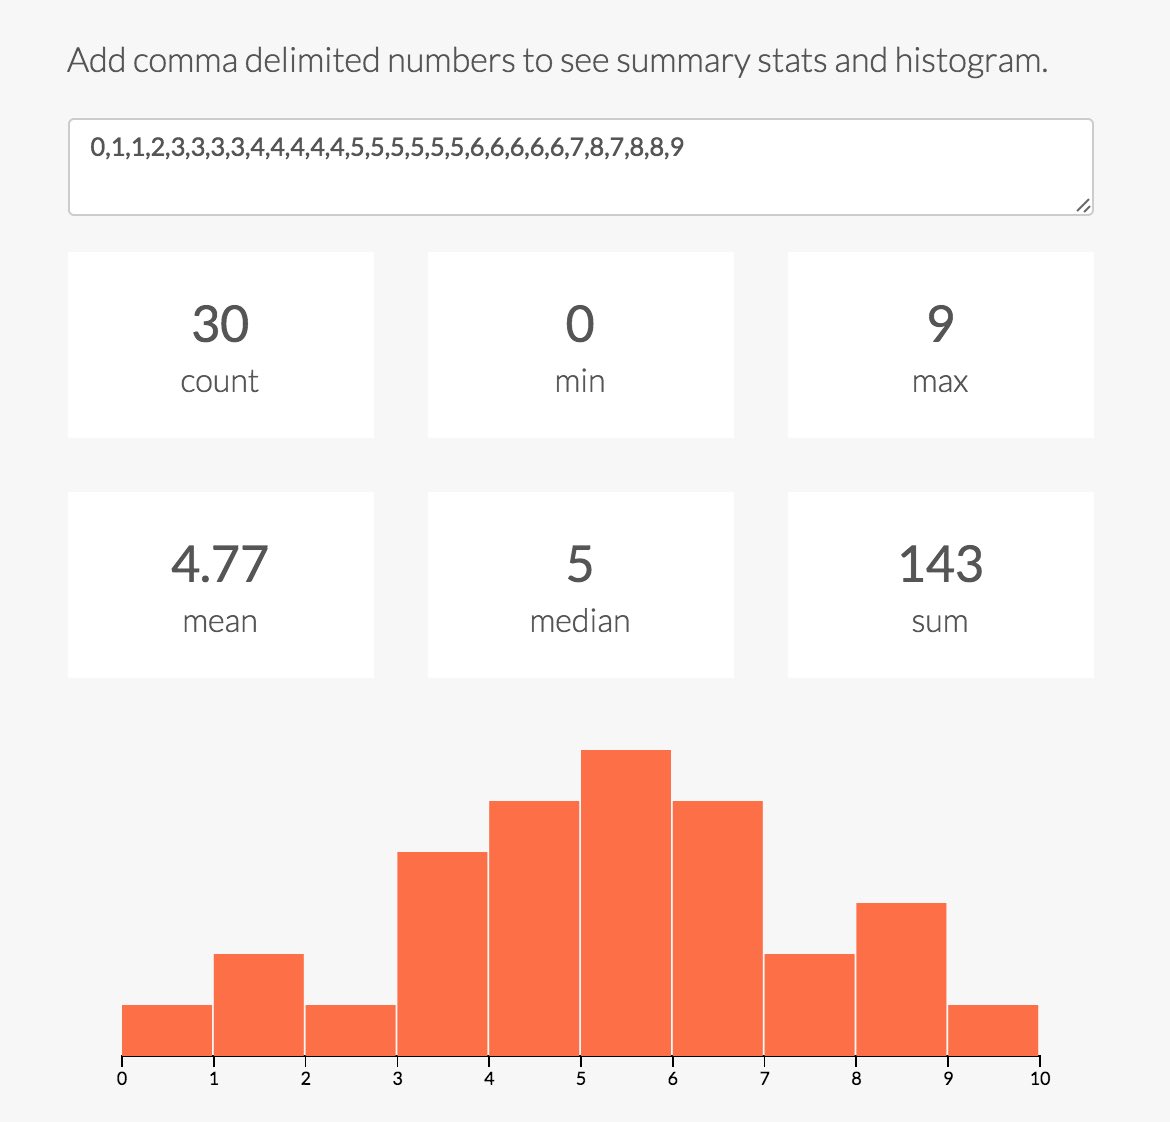
It’s composed of 3 components: the input text box, the stats, and the histogram.
Below is the Main component, which contains the input box (and its initial value), handles when the user adds/updates text, and parses the text into numbers (which get passed to the Stats and Histogram components).
var Main = React.createClass({
    getInitialState: function() {
        var starter_nums = [
            0,1,1,2,3,3,3,3,4,4,4,4,4,5,5,
            5,5,5,5,6,6,6,6,6,7,8,7,8,8,9
        ];

        return {
            text: starter_nums.join(','),
        };
    },

    handleChange: function(e) {
        this.setState({
            text: e.target.value
        });
    },

    getNumbers: function() {
        var numbers = this.state.text.split(','),
        data = [];

        numbers.forEach(function(n) {
            var num = parseFloat(n);
            if (!isNaN(num)) data.push(num);
        });

        return data;
    },

    render: function() {
        var data = this.getNumbers();

        return (
          <div>
            <p className="lead">
                Add comma delimited numbers to see summary
                stats and a histogram.
            </p>
            <textarea
                className="form-control"
                onChange={this.handleChange}
                defaultValue={this.state.text}
                placeholder="Add comma delimited numbers"></textarea>
            <br/>
            <Stats data={data} />
            <Histogram data={data} />
            <hr/>
            <p>
                <a href="https://github.com/brendansudol/react-d3-histogram">
                    github repo →
                </a>
            </p>
          </div>
        );
    }
});
The Stats component is very simple. It takes in the parsed numbers from the input box, uses the Simple Statistics library to compute some descriptive stats (mean, median, etc.), and renders them as stat cards in a grid layout.
var ss = require('simple-statistics');

var Stats = React.createClass({
    format: function(x) {
        if (isNaN(parseFloat(x))) return '—';

        if (x % 1 === 0) {
            return x;
        } else if (x < 0.1) {
            return x.toFixed(3);
        } else {
            return x.toFixed(2);
        }
    },

    get_stats: function() {
        var data = this.props.data;

        return {
            count: data.length,
            mean: ss.mean(data),
            median: ss.median(data),
            mode: ss.mode(data),
            min: ss.min(data),
            max: ss.max(data),
            sum: ss.sum(data),
        };
    },

    render: function() {
        var stats = this.get_stats();
        var display_stats = [
            'count', 'min', 'max',
            'mean', 'median', 'sum'
        ];
        var self = this;

        return (
          <div className="row">
            {
                display_stats.map(function(name) {
                    return (
                        <div key={name} className="col-xs-6 col-sm-4">
                            <div className="stat-box">
                                <div className="stat-num">
                                    {self.format(stats[name])}
                                </div>
                                <div className="stat-name">
                                    {name}
                                </div>
                            </div>
                        </div>
                    );
                })
            }
          </div>
        );
    },
});
And finally, we have the Histogram component. Here’s where I mix in some D3.js. Both React and D3 are opinionated about how things should be rendered and updated. For this, I’m deferring most of that logic to D3 and hooking into React’s lifecycle methods of componentDidMount and componentDidUpdate to trigger when D3 should create the visualization and update it as the input data changes.
var d3 = require('d3');

var Histogram = React.createClass({
    getDefaultProps: function() {
        return {
            data: [1,2,3,3,4,5,5,6,7,7,8,8,9,10],
            width: 570,
            height: 210,
            margin: {top: 10, right: 30, bottom: 30, left: 30},
            buckets: 10
        };
    },

    componentDidMount: function() {
        this.createChart();
    },

    componentDidUpdate: function() {
        if (this.props.data.length) this.updateChart();
    },

    render: function(){
        return (
          <div id="viz" className={this.props.data.length ? '' : 'hidden'}>
            <svg ref="svg"/>
          </div>
        );
    },

    createChart: function() {
        var w = this.props.width,
            h = this.props.height,
            m = this.props.margin;

        this.chart_width = w - m.left - m.right;
        this.chart_height = h - m.top - m.bottom;

        this._setXscale();
        this._binData();
        this._setYscale();

        this.xAxis = d3.svg.axis()
            .scale(this.x)
            .ticks(this.props.buckets)
            .orient("bottom");

        var svg = d3.select(React.findDOMNode(this.refs.svg))
            .attr("class", "histogram")
            .attr("width", w)
            .attr("height", h)
            .append("g")
            .attr("transform", "translate(" + m.left + "," + m.top + ")");

        svg.append("g")
            .attr("class", "x axis")
            .attr("transform", "translate(0," + this.chart_height + ")")
            .call(this.xAxis);

        var self = this;

        svg.selectAll(".bar")
            .data(self.data_binned)
            .enter().append("rect")
            .attr("class", "bar")
            .attr('x', function(d) { return self.x(d.x); })
            .attr('y', function(d) { return self.y(d.y); })
            .attr("width", self.x(self.data_binned[0].dx) - 1)
            .attr("height", function(d) {
                return self.chart_height - self.y(d.y);
            });
    },

    updateChart: function() {
        this._setXscale();
        this._binData();
        this._setYscale();

        d3.select('.x.axis')
            .transition().duration(300)
            .call(this.xAxis.scale(this.x));

        var g = d3.select(React.findDOMNode(this.refs.svg))
            .select('g');

        var bars = g.selectAll('.bar')
            .data(this.data_binned);

        bars.exit()
            .transition().duration(300)
            .style('fill-opacity', 1e-6)
            .remove();

        bars.enter().append("rect")
            .attr("class", "bar")
            .attr("y", this.y(0))
            .attr("height", this.chart_height - this.y(0));

        var self = this;

        bars.transition().duration(300)
            .attr("x", function(d) { return self.x(d.x); })
            .attr("y", function(d) { return self.y(d.y); })
            .attr("width", self.x(self.data_binned[0].dx) - 1)
            .attr("height", function(d) {
              return self.chart_height - self.y(d.y);
            });
    },

    _binData: function() {
        this.data_binned = d3.layout.histogram()
            .bins(this.x.ticks(this.props.buckets))
            (this.props.data);
    },

    _setXscale: function() {
        this.x = d3.scale.linear()
            .domain([0, Number(d3.max(this.props.data)) + 1])
            .range([0, this.chart_width]);
    },

    _setYscale: function() {
        this.y = d3.scale.linear()
            .domain([0, d3.max(this.data_binned, function(d) { return d.y; })])
            .range([this.chart_height, 0]);
    }
});
And that’s it. Here’s the demo of everything together. And here’s the repo with the components and example page. I used Webpack to package up the JS into one bundle for the example page. Webpack is awesome BTW, but I’ll save that for another post :) Until then, I can’t wait to learn and dig in more with React!